
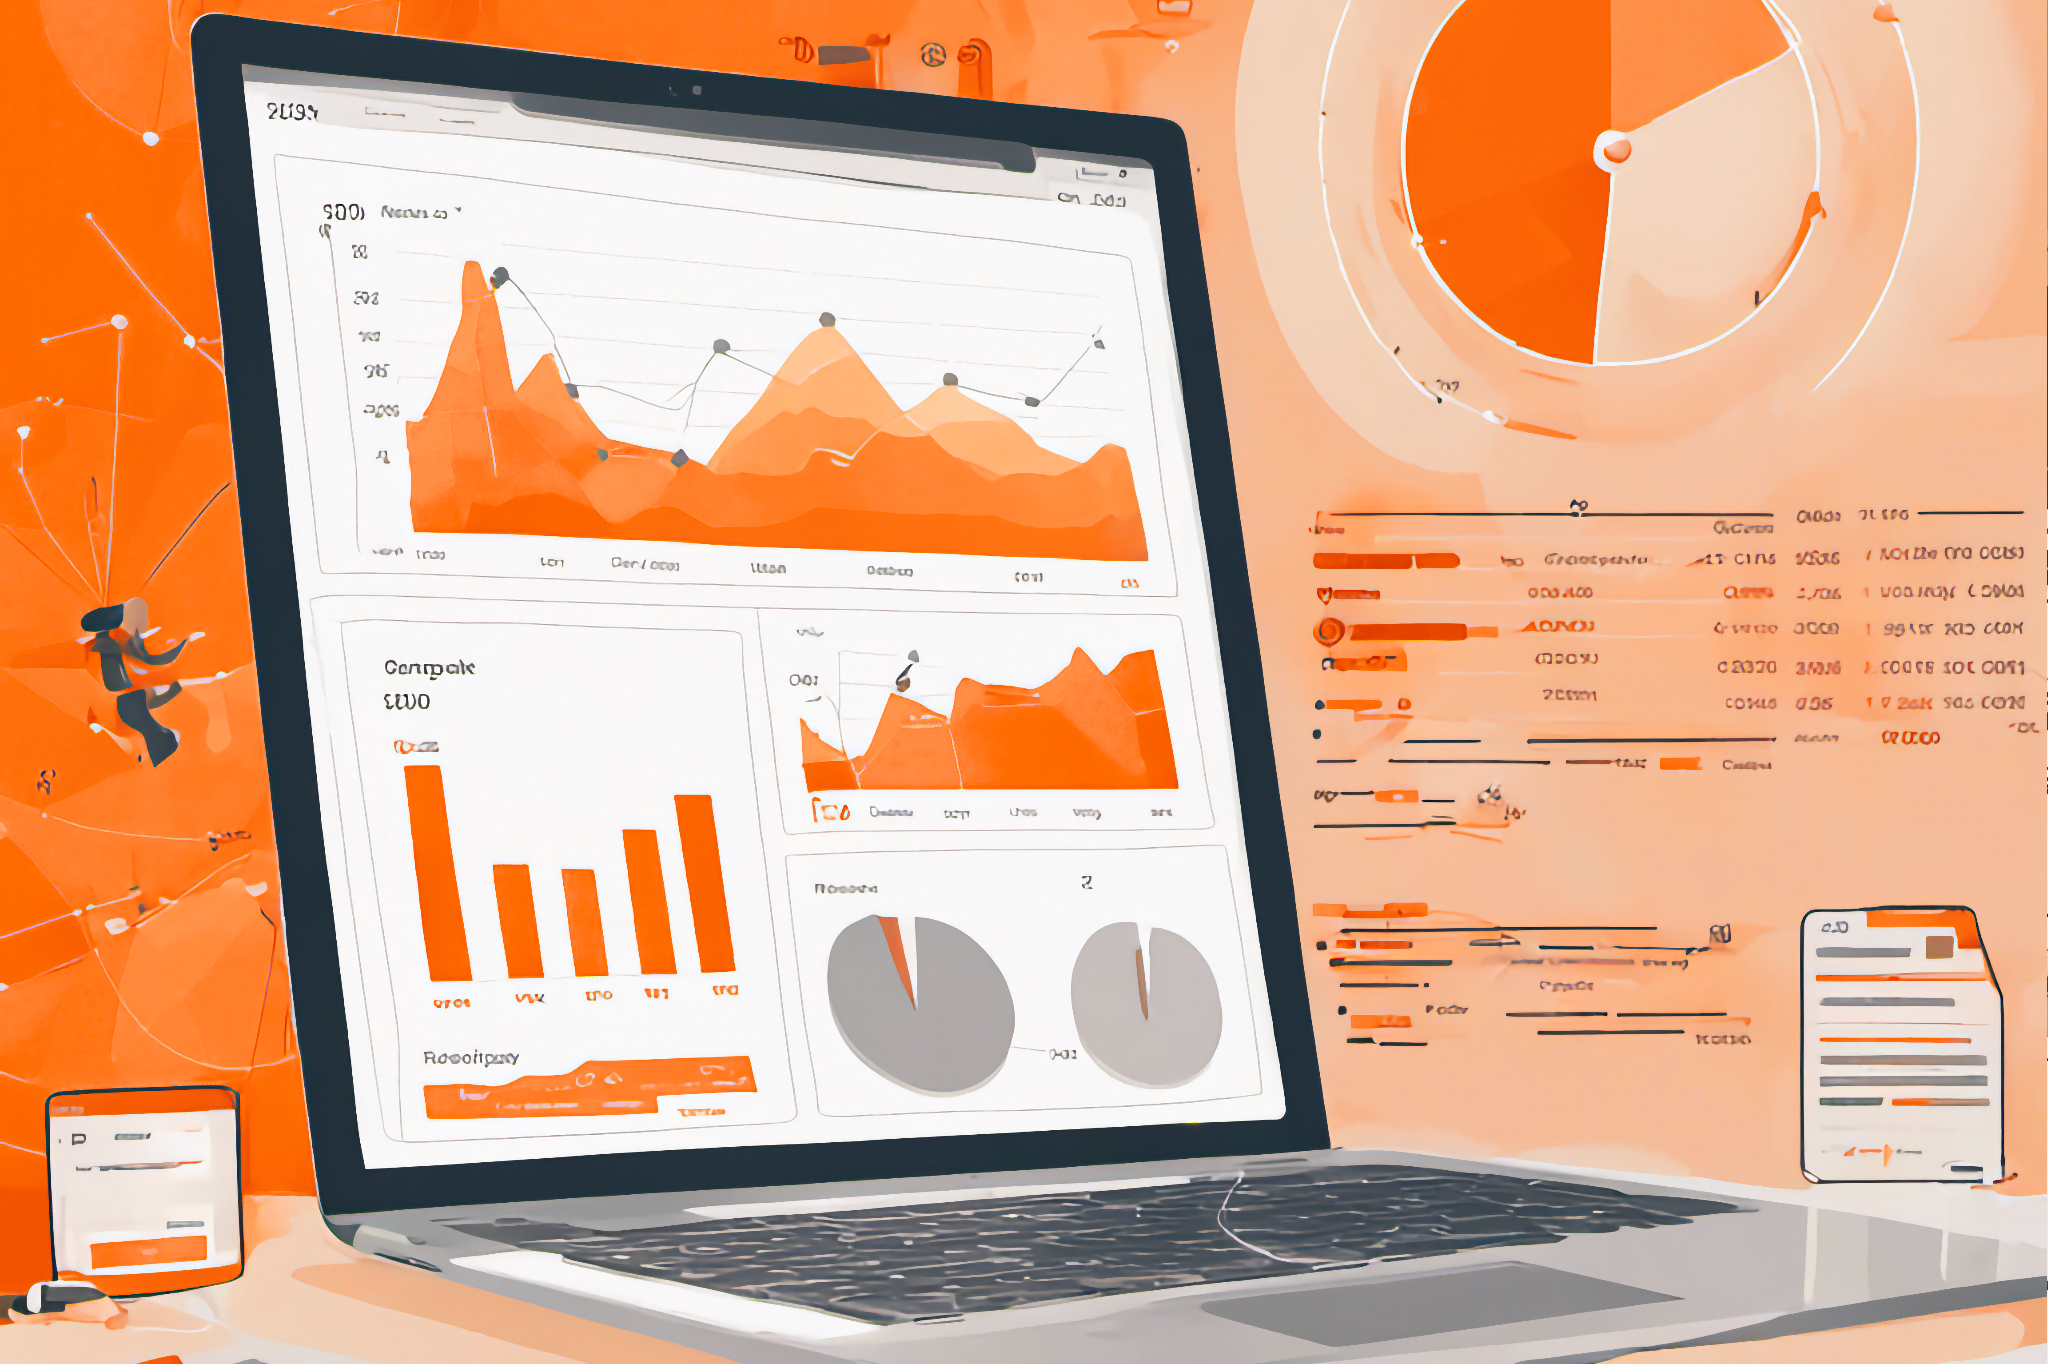

In the world of business, data is the new gold. It’s the treasure that can guide your ship towards growth and success. But to unlock its true value, you need the right tools. That’s where HubSpot analytics and reporting come in. This powerful platform is more than just a compass—it’s your entire navigational chart, providing you with the insights you need to make data-driven decisions.
The power of HubSpot Analytics
HubSpot is like a Swiss Army knife for data. It’s packed with analytics tools that can help you monitor everything from website traffic to email open rates, meetings booked, calls made, deals created and won, and more.
But let’s get specific. HubSpot’s analytics tools allow you to track website performance, including page views, session duration, bounce rates, and much more.
You can also monitor your social media performance, tracking likes, shares, comments, and followers across different platforms.
And let’s not forget about email analytics, which let you track open rates, click-through rates, and bounce rates, helping you optimise your email marketing strategy. You can even monitor your email sending reputation to avoid penalties or blacklisting.
And what about Sales or Customer Success? HubSpot let’s you track everything, from calls made to proposals sent, deals created and won (or lost!), time from creation to close, top-performing Sales members, support tickets created, SLAs met (or not), customer satisfaction scores… the lot!
HubSpot Reporting: your business’s crystal ball
But HubSpot doesn’t stop at analytics. It also offers robust reporting features that can provide a clear picture of your business operations. These reports can help you identify areas of focus or those needing improvement.
HubSpot’s custom reporting tools allow you to create detailed reports based on your specific needs. Even the standard out-of-the-box reports provide valuable data-led insight into how your business is performing.
Want to know which marketing campaigns are driving the most traffic or conversions? Which sales content drives the most conversions? Which sales reps are closing the most deals? Or which customers are taking up most of your time with support requests? HubSpot’s got you covered.
You can even create dashboards to keep all your key metrics in one place, making it easy to monitor your performance at a glance and over time.
Best practices for using HubSpot Analytics and Reporting
To get the most out of HubSpot’s analytics and reporting features, it’s important to follow a few best practices.
First, set clear goals. Whether you’re looking to increase website traffic, boost sales, or improve customer service, having clear goals will help you focus your efforts and measure your progress.
Next, make a habit of regularly reviewing your data. The beauty of HubSpot is that it provides real-time analytics, so you can monitor your performance and make adjustments as needed. You can event set up periodic email reports and Slack notifications for your key reports and dashboards to get regular updates direct to your inbox.
Finally, don’t be afraid to dive deep into the data. HubSpot’s reporting features allow you to drill down into the details, so you can get a granular view of your operations and identify any potential issues or opportunities.
A walkthrough of data-driven decision making with HubSpot
To illustrate how this all works, let’s consider a hypothetical (but common) scenario. Imagine you’re a Marketing Director who wants to assess the return on advertising spend (ROAS) across different paid media channels.
Using HubSpot’s analytics tools, you can track the performance of each channel, monitoring metrics like impressions, clicks, and conversions. You can also use HubSpot’s attribution reports to see which channels are driving the most conversions and revenue.
After analysing the data, you discover that your social media ads are outperforming your search ads in terms of ROAS. Armed with this insight, you decide to reallocate more of your budget to social media advertising.
Once these changes are implemented, you use HubSpot’s reporting features to monitor their impact. You see that your ROAS for social media ads is increasing, validating your data-driven decision.
Conclusion
In the business world, making decisions based on gut feelings can be risky. But with HubSpot’s analytics and reporting features, you’re swapping guesswork for a well-lit path. These tools are your business’s personal detective and crystal ball, providing a comprehensive view of your operations and clear insights into areas needing improvement.
Our walkthrough showcased the power of data-driven decision making. By using HubSpot analytics and reporting features, you can assess performance across different channels and business areas, reallocate resources effectively, and monitor the impact of your decisions.
In short, data is your compass, your map, and your guiding star. And with HubSpot as your co-pilot, you’re well-equipped to navigate a path to success.
Are you stuggling to make data-driven decisions in your business? Contact me today to see how HubSpot can can help your business thrive.